STAGBEETLE
SUPLEMENTARY INFORMATION
OTHER INFORMATION
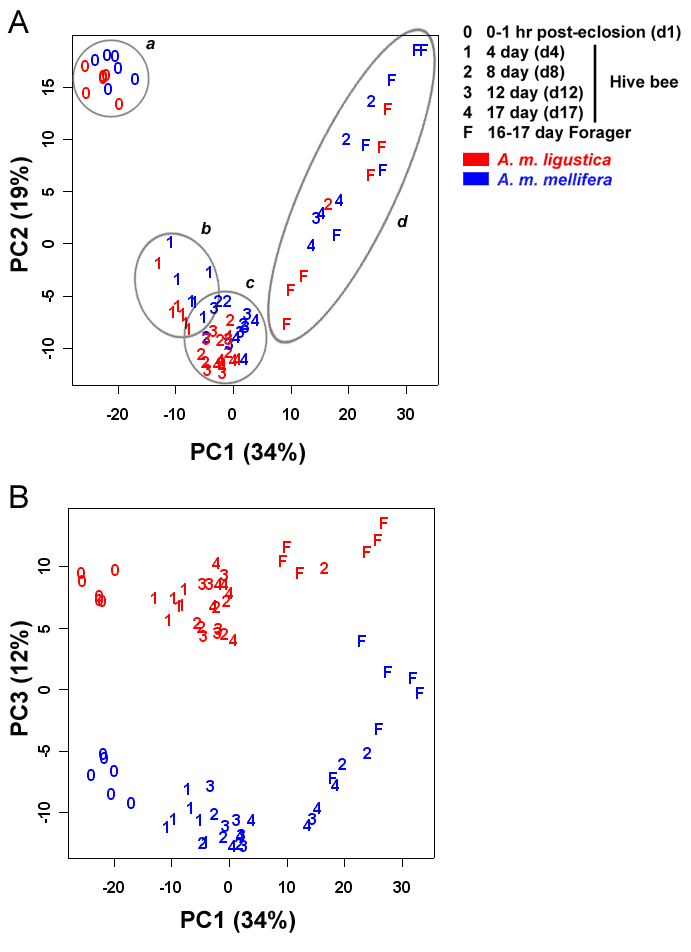
Fig. 1. Division of labor in honey bee colonies and brain gene
expression: age-related, behavior-related, and genetic differences. Principal
component analysis (PCA) was performed using brain gene expression measurements
for all 5736 genes from all 72 bees in Experiment 1. Individual bees are plotted
as a function of PC1 and PC2 (A) or
PC1 and PC3 (B). Ontogenetic group and
subspecies are indicated in legend. Cumulative variance explained by PCs is
indicated on axis (see Fig. S2 and Table S1 for all PCs).