STAGBEETLE
SUPLEMENTARY INFORMATION
OTHER INFORMATION
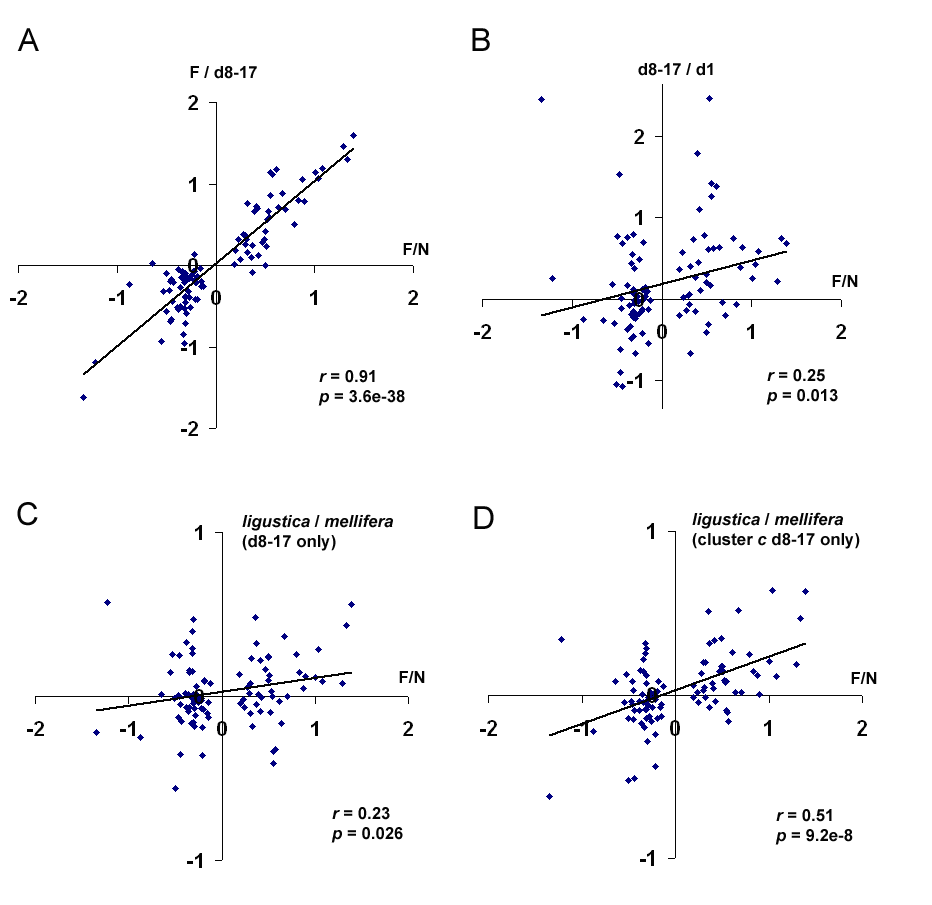
Fig. S3. The top 100 nurse-forager markers plotted as a function of forager/nurse brain gene expression ratios from ref. 1 (x-axis) and expression ratios from the present study for the following (y-axis): (A) F/d8-17 (hive bee-to-forager differences); (B) d8-17/d1 (pre-foraging maturation differences); (C) ligustica/mellifera (d8, d12 and d17 only); (D) ligustica/mellifera (d8, d12 and d17, excluding 7 outliers that appeared in cluster d in Fig 1A and were probably foragers).