STAGBEETLE
SUPLEMENTARY INFORMATION
OTHER INFORMATION
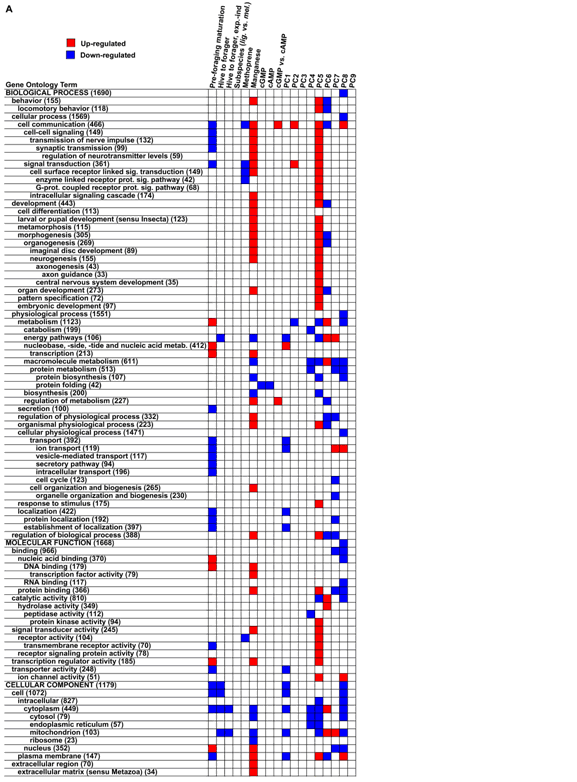
Fig. S4. Functional analysis of honey bee brain gene expression with Gene Ontology (GO). (A) GO categories significantly associated with one or more of the gene lists generated in Experiments 1-3 (see Table 1) on the basis of a “directional bias” within a particular GO category, i.e., a disproportionately high number of genes in a category that were either up- or down-regulated in one of our gene lists (p < 0.001; Chi-squared tests with Yates’ continuity correction). Numbers in parentheses indicate number of genes analyzed in each GO category (exact number differed between the 3 microarray experiments; minimum is shown). PCA gene lists are the upper and lower 10% for each PC based on scaled gene loadings (polarity is arbitrary). P-values (for significant gene lists) and percentiles (for PCs) were chosen to produce gene lists of comparable sizes. (B) Representational bias **not formatted yet**