STAGBEETLE
SUPLEMENTARY INFORMATION
OTHER INFORMATION
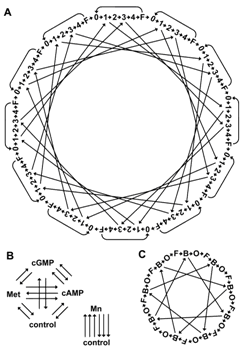
Fig. S5. Microarray experimental design. For all experiments, arrows indicate microarrays and nodes indicate samples (arrow tail, Cy3-labeled sample; arrowhead, Cy5-labeled sample). (A) Experiment 1. Gene expression profiles were compared for 72 individual brains with 108 microarrays. Bees were 0-1 hr post-eclosion (0), hive bees at 4, 8, 12, and 17 days of age (1, 2, 3, 4, respectively), and 16- or 17-day-old foragers (F). Bees were from two subspecies (A. m. ligustica and A. m. mellifera) co-fostered together in host colonies from each of the two subspecies. The basic design unit (0ŕ1ŕ2ŕ3ŕ4ŕFŕ0) was always within subspecies and within colony, and was repeated (top, moving clockwise): LM, LM, LM, MM, MM, MM, ML, ML, ML, LL, LL, LL (letter indicates individual subspecies; subscript indicates host colony subspecies; L, ligustica; M, mellifera). Microarrays crossing the middle of the design directly compare subspecies (within host colony) or host colonies (within subspecies) for 4- and 12-day old hive bees. Each sample was hybridized to 2, 3, or 4 microarrays as shown. (B) Experiment 2. Pooled samples (~50 dissected brains each) from 4 neuroactive treatment groups and 2 control groups were directly compared with 40 microarrays. Methoprene (Met), cGMP, and cAMP were compared to a common vehicle control and, separately, manganese (Mn) was compared to its vehicle control. Each sample was hybridized to 6, 7 or 8 microarrays as shown. (C) Experiment 3. Gene expression profiles were compared for 27 individual brains with 36 microarrays. Individual bees were foragers (F) and “hive-restricted” (B). A third group (O) was not analyzed in the